


东南大学Zhao同学
普林斯顿大学机械工程博士全奖
美本考试:AP统计学重点知识汇总
发布时间:2017年05月14日 来源:互联网
毕达留学是一家以“录名校、做口碑”为理念的留学咨询机构,专注本科、硕士和博士等各阶段的海外名校申请。毕达注重个性化和透明化的申请服务,致力于申请者学术和职业素养的提升,帮助申请者从本质上提升竞争力并获名校录取。众多超预期的名校录取,是毕达打造以口碑传播为核心的基础。正因如此,每年都有众多学生以照片和视频形式为毕达留学公开代言。查看更多
申请美本留学的小伙伴很快都要步入AP火葬场啦,下面根据Barron的参考书捋出来了AP统计考试重点知识,这些知识点既适用于正准备开始预习统计明年考试的学生,又适用于已经进入最后复习阶段的同学们,大家赶紧收好吧!
Topic 1:Graphical Displays
本章介绍了几种图
对于这几种图表,大家需要掌握其特征:
1.Dot-plots
2.Bar Chart
3.Histograms
4.Stemplots
5.Cumulative relative frequency plot
*其中Stemplots是选择题图表题易考点,其出题点一般在于对比。
每个图形描述
1.Center and Spread
2.Outliers
3.Cluster and Gap
4.Shape
Topic 2:Summarizing Distributions
本章强调了几个点,其概念一定要掌握清晰:
1.Mean and median
2.Range(Difference between largest and smallest number)
3.Interquatile range(=Q3-Q1)
4.Variance
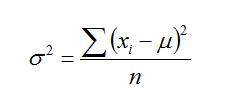
5.Standard deviation
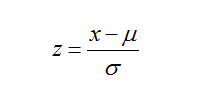
6.Z-score
7.Empirical Rule(适用于钟形分布的统计数据,详细解释参见书本)
8.Box-plot:是最容易考察的图表点,我们要知道如何将第一章5类图表转换为Box-plot。而Box-plot则可以完美的体现median、25 percentile、75 percentile、outliers。
Topic 3:Comparing Distribution
本章只有两个考点:
1.Parallel Box-plots
2.Back-to-back Stemplots
*作对比时,主要描述Shape、Center以及Cluster等。
Topic 4:Exploring Bivariate data
1.Scatterplot:可以显示出变量正向或者负向的关系;Correlation是非常重要的参考标准,与Z-score相关,如果改变变量单位r 也不会改变;Slope与r和标准差有关;
2.Residual plots;The sum of the residuals is always zero;
3.Outliers & Influential points;Influential points:points whose removal would sharply change the regression line。
Topic 5: Frequency Table
本章是之后几章的一个基础,知识点不多。
1.Two-way contingency table:—marginal frequencies—marginal distribution
2.Lurking variable 这是大家容易忽视的一个知识点,选择题大题都曾经考到过。(第8章提过)
Topic 6: Methods of data collection
1.Census:特点——没有偏差
2.Sampling survey:特点——因为是随机抽样(randomness),所以出现倾向性误差概率小;经济性好;实用性强;会有bias。
3.Experiment:特点——有treatment group和control group;cause and effect relationship;需要重复试验(replication)具有普遍性(generalizability);
4.observational study:sampling surveys are one example of observational study;Observing responses to choices people make.
Topic 7: Planning and conducting Surveys
1.Simple Random Sample(SRS)
2.Sampling Error
3.Bias:-Household Bias
-Nonresponse Bias
-Quota Sampling Bias
-Response Bias
-Selection Bias
-Size Bias
-Under-coverage Bias
-Voluntary Response Bias
-Wording Bias
4.Systematic Sampling
5.Stratified sampling:优势在于不容易出现偏差
6.Cluster Sampling:优势在于省时间
7.Multistage Sampling
*标蓝色的两种方法是必考项,而且因为他俩容易混淆,所以总放在一起考,大家一定把他们概念以及优势区分开。
Topic 8: Planning and conducting experiments
Experiment VS Observational study
An experiment often suggests a casual relationship, while an observational study may show only the existence of associations.实验得到的是因果关系,观察性学习得到的是存在的关系。
Experiments
explanatory variables(factors) Response variables:
1.Confounding;Control Groups;Placebo Effects;Blinding这四点是在描述实验时需要注意的,一定避免面对问题,简答题考察会更多一些
2.Treatments;Experimental Units;Randomization以上三点为设计实验时要考量的,这是每个实验设计的基础。
3.Replication;Blocking此两点为可行的,可以得到普遍性结果的方法。
Topic 9:Probability as Relative Frequency
1.Mutually exclusive
2.Independent Events
3.Binomial Formula:成功多少次的概率
4.Geometric Probability:第多少次成功的概率
5.Expected Value and Standard Deviation
*第五条是为后面章节的一个铺垫,这是第一次我们正式引入平均数和标准差,为后面假设检验或置信区间做铺垫。
Topic 10:Combining Independent Random Variables
本章需要掌握知识点不多:
1.当X与Y相互独立时,我们需要知道他们之间存在的关系式。
2.E(bX+/-a)=bE(X)+/- a
3.Var(bX+/- a)=b^2 Var(X)
4.两个相互独立的变量的方差相加减的结果与平均数相加减的结果公式需要掌握。
Topic 11:normal distribution
本章对计算器使用的考察比较多:
1.Z-score计算公式以及具体理解;
2.如何确认是正态分布:画图;
3.计算在正态曲线下的面积需要用TI-84计算器的normalcdf;
4.计算正态曲线上某点的可能性用TI-84计算器的invNorm。
Topic 12:Sampling Distribution
本章开始,我们要接触大题解法了。所以画的重点一定要好好看!
1.sampling distribution of a sample proportion:这里面需要知道怎么算平均数以及标准差,并且与其他区分开。推理过程也需要知道,因为有时候大题第六题有延伸知识点的。
2.Sampling distribution of a difference between two independent sample proportion:这是第1点的一个延伸,在验证条件时需注意要多验证一条两个样本互相独立。
3.Sampling distribution of a sample mean:一定要区分和sample proportion的区别,并且知道sample mean的推理以及公式。
4.Sampling distribution of a difference between two independent sample means:这是第3点的延伸,验证条件时也需注意验证两个样本相互独立。
5.Central limit theorem:这个是指当n大于等于30时,我们可以认为已经从总体中抽取了足够大的样本并且足以确定样本的准确性。
6.T-distribution:与其他的区别在于我们不知道总体的标准差,并且知道总体的分布是正太的,这时需要用t-distribution。其公式与其他不太一样,一定要注意。
7.Chi-square distribution:df越小,其分布越向右;而当df无穷大时,其分布近乎于对称,与t-distribution类似。
8.Standard Error(SE):样本均值的标准差。
Topic 13:Confidence Interval
本章为大题考点之一,也是我们所说的必拿分项。
1.首先要理解置信区间的定义是什么,按照常理说每次的选择题必有一题考察定义。并掌握其公式estimate +/- margin of error。
2.本章展开了很多种置信区间,一下全都需要熟悉掌握步骤:
Confidence interval for a proportion
Confidence interval for a difference of two proportions
Confidence interval for a mean
Confidence interval for a difference between two means
Confidence interval for the slope of a least regression line
五项做题思路完全一样:
首先,验证条件,确认建立哪个置信区间。
其次,列出公式,准确找到平均值与标准差。
再者,得出结果。
最后,文字叙述得出结论。
大部分同学们会不太熟悉的一个点,它起源于Topic 4,当时只是很浅显的介绍了Least Square Regression Line。
Topic 14:Tests of Significance-Proportions and Means
本章不但是老知识的延伸,同时还有一些新知识的增加。
先说新知识
1.掌握原假设和备择假设的关系以及定义。选择题必考,大题解答的基础
2.Type I error 和Type II error的定义,选择题必考。
3.理解power的起源以及概念。知道power 和Type II error的关系。
4.了解以下几种假设检验方法,知道假设检验怎么做:
Hypothesis Test for a proportion
Hypothesis Test for a difference between two proportions
Hypothesis Test for a mean
Hypothesis Test for a difference between two means(unpaired and paired)
以上四项的假设检验套路如下:
首先,验证条件,做出假设;
其次,列出公式,找到对应数据。
再者,得到P值,与Significant Level作比较。
最后,得出文字性结论。
Topic 15:Test of Significance-Chi-Square and Slope of Least Squares Line
本章为难点,注意看重点哟!
1.本章首先介绍三个检验:Chi-Square Test For Goodness of Fit(拟合优度检验)Chi-Square Test for Independence(独立性检验)Chi-Square Test for Homogeneity of Proportion以上三个检验,都需要掌握不一样的验证条件与公式,与前文所有检验有所不同。
2.Hypothesis Test for Slope of Least Square Line这个假设检验,所需验证的条件有四项,详见参考书。有一点需要注意的是大题通常会给我们一个图以及一个带有很多数据,我们需要知道哪个数据是我们可以用的,哪个数据是迷惑项,具体参见例题。
Topic 1:Graphical Displays
本章介绍了几种图
对于这几种图表,大家需要掌握其特征:
1.Dot-plots
2.Bar Chart
3.Histograms
4.Stemplots
5.Cumulative relative frequency plot
*其中Stemplots是选择题图表题易考点,其出题点一般在于对比。
每个图形描述
1.Center and Spread
2.Outliers
3.Cluster and Gap
4.Shape
Topic 2:Summarizing Distributions
本章强调了几个点,其概念一定要掌握清晰:
1.Mean and median
2.Range(Difference between largest and smallest number)
3.Interquatile range(=Q3-Q1)
4.Variance
5.Standard deviation
6.Z-score
7.Empirical Rule(适用于钟形分布的统计数据,详细解释参见书本)
8.Box-plot:是最容易考察的图表点,我们要知道如何将第一章5类图表转换为Box-plot。而Box-plot则可以完美的体现median、25 percentile、75 percentile、outliers。
Topic 3:Comparing Distribution
本章只有两个考点:
1.Parallel Box-plots
2.Back-to-back Stemplots
*作对比时,主要描述Shape、Center以及Cluster等。
Topic 4:Exploring Bivariate data
1.Scatterplot:可以显示出变量正向或者负向的关系;Correlation是非常重要的参考标准,与Z-score相关,如果改变变量单位r 也不会改变;Slope与r和标准差有关;
2.Residual plots;The sum of the residuals is always zero;
3.Outliers & Influential points;Influential points:points whose removal would sharply change the regression line。
Topic 5: Frequency Table
本章是之后几章的一个基础,知识点不多。
1.Two-way contingency table:—marginal frequencies—marginal distribution
2.Lurking variable 这是大家容易忽视的一个知识点,选择题大题都曾经考到过。(第8章提过)
Topic 6: Methods of data collection
1.Census:特点——没有偏差
2.Sampling survey:特点——因为是随机抽样(randomness),所以出现倾向性误差概率小;经济性好;实用性强;会有bias。
3.Experiment:特点——有treatment group和control group;cause and effect relationship;需要重复试验(replication)具有普遍性(generalizability);
4.observational study:sampling surveys are one example of observational study;Observing responses to choices people make.
Topic 7: Planning and conducting Surveys
1.Simple Random Sample(SRS)
2.Sampling Error
3.Bias:-Household Bias
-Nonresponse Bias
-Quota Sampling Bias
-Response Bias
-Selection Bias
-Size Bias
-Under-coverage Bias
-Voluntary Response Bias
-Wording Bias
4.Systematic Sampling
5.Stratified sampling:优势在于不容易出现偏差
6.Cluster Sampling:优势在于省时间
7.Multistage Sampling
*标蓝色的两种方法是必考项,而且因为他俩容易混淆,所以总放在一起考,大家一定把他们概念以及优势区分开。
Topic 8: Planning and conducting experiments
Experiment VS Observational study
An experiment often suggests a casual relationship, while an observational study may show only the existence of associations.实验得到的是因果关系,观察性学习得到的是存在的关系。
Experiments
explanatory variables(factors) Response variables:
1.Confounding;Control Groups;Placebo Effects;Blinding这四点是在描述实验时需要注意的,一定避免面对问题,简答题考察会更多一些
2.Treatments;Experimental Units;Randomization以上三点为设计实验时要考量的,这是每个实验设计的基础。
3.Replication;Blocking此两点为可行的,可以得到普遍性结果的方法。
Topic 9:Probability as Relative Frequency
1.Mutually exclusive
2.Independent Events
3.Binomial Formula:成功多少次的概率
4.Geometric Probability:第多少次成功的概率
5.Expected Value and Standard Deviation
*第五条是为后面章节的一个铺垫,这是第一次我们正式引入平均数和标准差,为后面假设检验或置信区间做铺垫。
Topic 10:Combining Independent Random Variables
本章需要掌握知识点不多:
1.当X与Y相互独立时,我们需要知道他们之间存在的关系式。
2.E(bX+/-a)=bE(X)+/- a
3.Var(bX+/- a)=b^2 Var(X)
4.两个相互独立的变量的方差相加减的结果与平均数相加减的结果公式需要掌握。
Topic 11:normal distribution
本章对计算器使用的考察比较多:
1.Z-score计算公式以及具体理解;
2.如何确认是正态分布:画图;
3.计算在正态曲线下的面积需要用TI-84计算器的normalcdf;
4.计算正态曲线上某点的可能性用TI-84计算器的invNorm。
Topic 12:Sampling Distribution
本章开始,我们要接触大题解法了。所以画的重点一定要好好看!
1.sampling distribution of a sample proportion:这里面需要知道怎么算平均数以及标准差,并且与其他区分开。推理过程也需要知道,因为有时候大题第六题有延伸知识点的。
2.Sampling distribution of a difference between two independent sample proportion:这是第1点的一个延伸,在验证条件时需注意要多验证一条两个样本互相独立。
3.Sampling distribution of a sample mean:一定要区分和sample proportion的区别,并且知道sample mean的推理以及公式。
4.Sampling distribution of a difference between two independent sample means:这是第3点的延伸,验证条件时也需注意验证两个样本相互独立。
5.Central limit theorem:这个是指当n大于等于30时,我们可以认为已经从总体中抽取了足够大的样本并且足以确定样本的准确性。
6.T-distribution:与其他的区别在于我们不知道总体的标准差,并且知道总体的分布是正太的,这时需要用t-distribution。其公式与其他不太一样,一定要注意。
7.Chi-square distribution:df越小,其分布越向右;而当df无穷大时,其分布近乎于对称,与t-distribution类似。
8.Standard Error(SE):样本均值的标准差。
Topic 13:Confidence Interval
本章为大题考点之一,也是我们所说的必拿分项。
1.首先要理解置信区间的定义是什么,按照常理说每次的选择题必有一题考察定义。并掌握其公式estimate +/- margin of error。
2.本章展开了很多种置信区间,一下全都需要熟悉掌握步骤:
Confidence interval for a proportion
Confidence interval for a difference of two proportions
Confidence interval for a mean
Confidence interval for a difference between two means
Confidence interval for the slope of a least regression line
五项做题思路完全一样:
首先,验证条件,确认建立哪个置信区间。
其次,列出公式,准确找到平均值与标准差。
再者,得出结果。
最后,文字叙述得出结论。
大部分同学们会不太熟悉的一个点,它起源于Topic 4,当时只是很浅显的介绍了Least Square Regression Line。
Topic 14:Tests of Significance-Proportions and Means
本章不但是老知识的延伸,同时还有一些新知识的增加。
先说新知识
1.掌握原假设和备择假设的关系以及定义。选择题必考,大题解答的基础
2.Type I error 和Type II error的定义,选择题必考。
3.理解power的起源以及概念。知道power 和Type II error的关系。
4.了解以下几种假设检验方法,知道假设检验怎么做:
Hypothesis Test for a proportion
Hypothesis Test for a difference between two proportions
Hypothesis Test for a mean
Hypothesis Test for a difference between two means(unpaired and paired)
以上四项的假设检验套路如下:
首先,验证条件,做出假设;
其次,列出公式,找到对应数据。
再者,得到P值,与Significant Level作比较。
最后,得出文字性结论。
Topic 15:Test of Significance-Chi-Square and Slope of Least Squares Line
本章为难点,注意看重点哟!
1.本章首先介绍三个检验:Chi-Square Test For Goodness of Fit(拟合优度检验)Chi-Square Test for Independence(独立性检验)Chi-Square Test for Homogeneity of Proportion以上三个检验,都需要掌握不一样的验证条件与公式,与前文所有检验有所不同。
2.Hypothesis Test for Slope of Least Square Line这个假设检验,所需验证的条件有四项,详见参考书。有一点需要注意的是大题通常会给我们一个图以及一个带有很多数据,我们需要知道哪个数据是我们可以用的,哪个数据是迷惑项,具体参见例题。
更多毕达成功案例


